
Observe
Observability Setup
APM, distributed tracing, log aggregation, and real-time metrics — we instrument your entire stack so you see everything, detect issues in minutes, and resolve them before users notice.
You can't fix what you can't see.
Most teams fly blind. Logs live in twenty different places, metrics are collected but never correlated, and when something breaks at 2 AM the first hour is spent figuring out where to look. Without unified observability, every incident is a fire drill — slow to detect, slower to resolve, and impossible to prevent next time.
CBM builds observability from the ground up — OpenTelemetry instrumentation, centralised telemetry pipelines, golden-signal dashboards, and intelligent alerting — so your team moves from reactive firefighting to proactive reliability engineering.
73%
Faster mean-time-to-detection after full observability rollout
60%
Reduction in false-positive alerts with tuned pipelines
<5min
Root-cause identification for P1 incidents
What We Deliver
Full-stack observability, not just monitoring
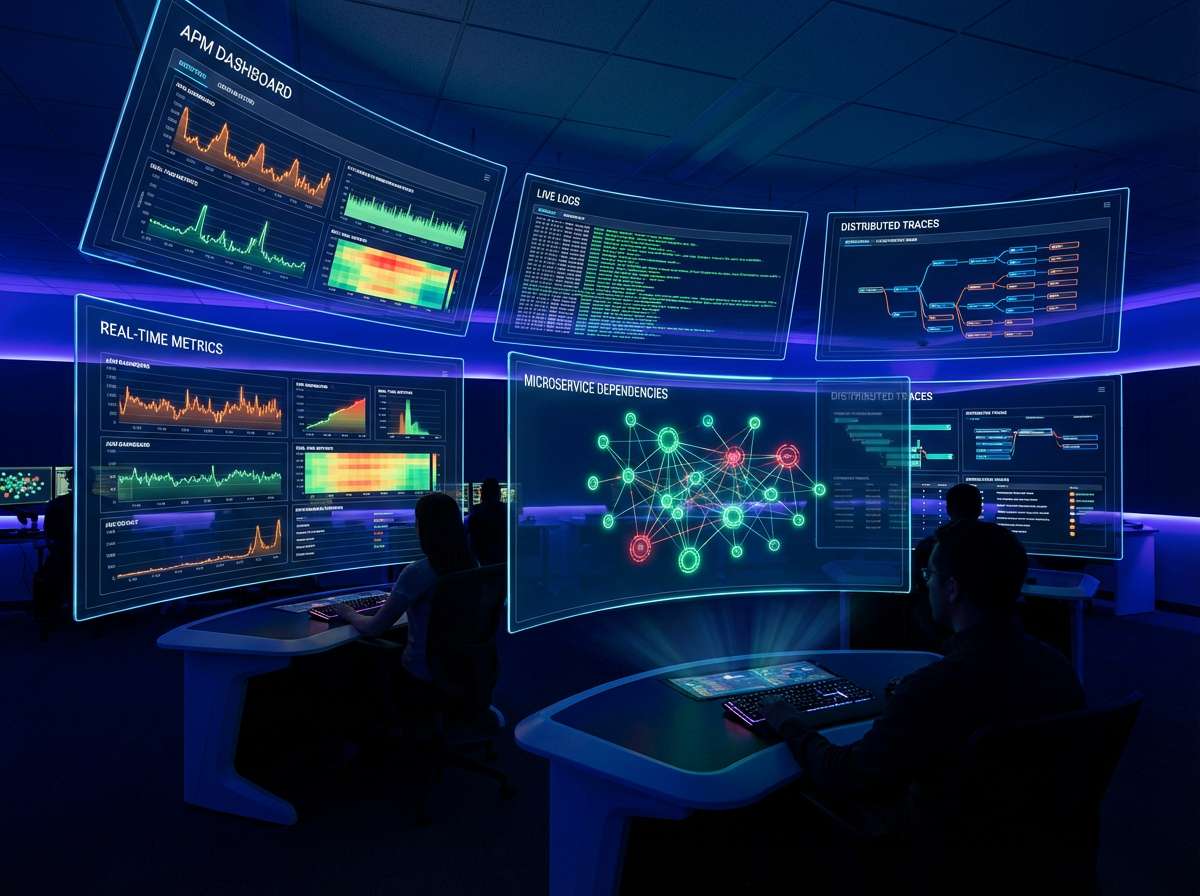
Monitoring tells you something is wrong. Observability tells you why. We instrument traces, metrics, and logs across every service so you can ask any question of your system — even ones you didn't anticipate.
APM & Distributed Tracing
End-to-end request tracing across every microservice, queue, and database call — pinpoint latency bottlenecks and error sources in seconds, not hours.
Log Aggregation & Analysis
Centralised log pipelines with structured indexing, full-text search, and correlation to traces — no more SSH-ing into boxes to grep through files.
Metrics & Dashboards
Golden signals (latency, traffic, errors, saturation) collected at every layer — Prometheus, StatsD, or OTLP — with real-time Grafana dashboards your team actually uses.
Alerting & On-Call
Multi-tier alert routing with intelligent grouping, de-duplication, and escalation policies — PagerDuty, Opsgenie, or Slack — so the right person wakes up, not everyone.
Infrastructure Monitoring
Host, container, and Kubernetes metrics with auto-discovery — CPU, memory, disk, network, pod health — correlated with application telemetry for full-stack visibility.
SLO & Error Budgets
Define service-level objectives, track error budgets in real time, and automate release gates — ship fast without burning reliability.
How We Work
From blind spots to full visibility
Observability Audit
We map your current telemetry coverage, identify blind spots, and assess instrumentation maturity across services, infrastructure, and CI/CD.
Architecture & Instrumentation
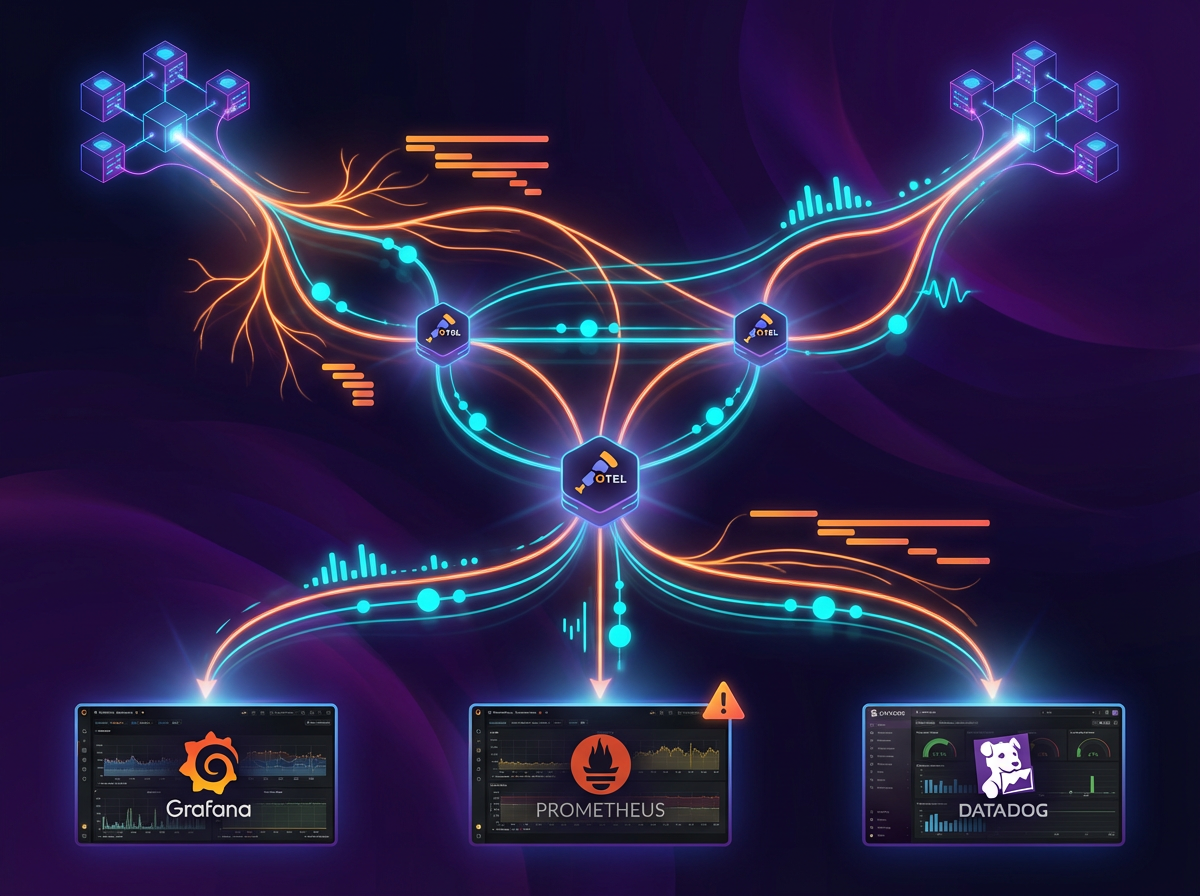
Design the telemetry pipeline — OpenTelemetry SDK integration, collector topology, sampling strategies, and backend selection — all documented before a single line ships.
Deploy & Validate
Roll out instrumentation service-by-service with canary validation. Build dashboards, configure alerts, and verify trace-to-log correlation end-to-end.
Operate & Evolve
Ongoing tuning — noise reduction, new SLO definitions, cost-optimised retention policies, and training so your team owns the stack long-term.
Technology
Vendor-neutral. Standards-first.
We build on OpenTelemetry and open-source tooling so you own your telemetry data — no proprietary lock-in, swap backends any time.
Tracing
- OpenTelemetry
- Jaeger
- Zipkin
- Tempo
- X-Ray
Metrics
- Prometheus
- Thanos
- Mimir
- CloudWatch
- StatsD
Logs
- Loki
- Elasticsearch
- Fluentd
- Vector
- CloudWatch Logs
Dashboards
- Grafana
- Datadog
- Kibana
- New Relic
- Dynatrace
Alerting
- PagerDuty
- Opsgenie
- Grafana Alerting
- Slack
- SNS
Platforms
- Kubernetes
- AWS
- Azure
- GCP
- Bare Metal
Ready to see everything happening in your stack?
Tell us about your services. We'll audit your telemetry coverage, design an observability architecture, and give you a clear rollout plan — no obligations.