
Observe
Real-Time Monitoring & Alerting
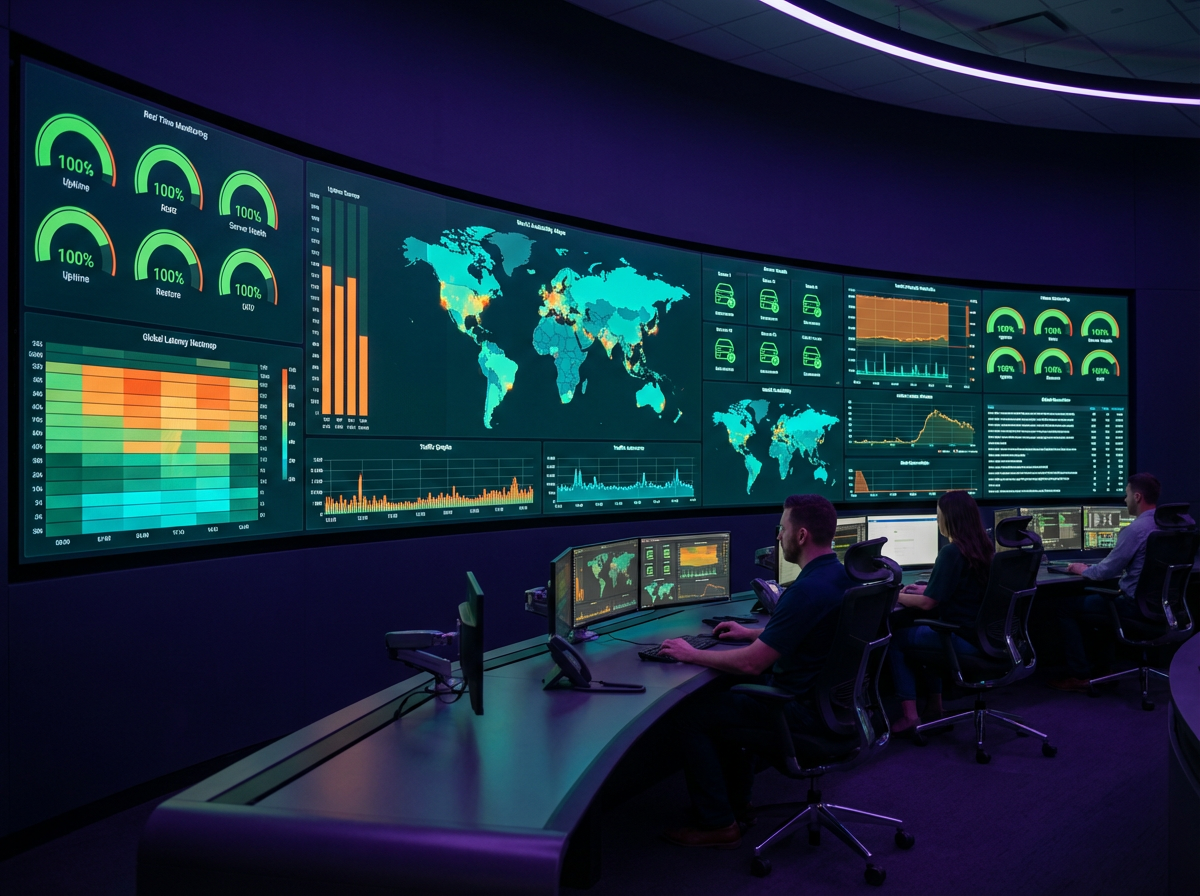
Proactive health checks, synthetic tests, and intelligent alert routing — we build monitoring systems that detect degradation in seconds and page the right engineer with full context, every time.
Your users shouldn't be your monitoring system.
If the first sign of an outage is a customer complaint on Twitter, your monitoring has already failed. Too many teams rely on reactive alerting — dashboards nobody watches, thresholds set once and never tuned, and on-call rotations where every page feels like a false alarm.
CBM builds monitoring that works proactively. Synthetic tests simulate real user journeys around the clock. Health checks run from multiple regions with consensus logic. Alerts fire only when they matter — grouped, de-duplicated, and routed to the right person with a runbook attached.
99.95%
Average uptime across monitored client environments
45s
Median time-to-detect for critical service degradation
80%
Reduction in alert noise after tuning engagement
What We Deliver
Detect, alert, and remediate — automatically
From synthetic probes to automated runbooks, we cover the full monitoring lifecycle — so your team spends time building features, not fighting fires.
Synthetic Monitoring
Simulated user journeys running 24/7 from global probe locations — know your checkout, login, or API is down before a single real user is affected.
Health Checks & Uptime
HTTP, TCP, DNS, and gRPC health checks at 30-second intervals with multi-region consensus — eliminate false positives while catching real outages instantly.
Real-User Monitoring (RUM)
Browser and mobile performance telemetry — Core Web Vitals, page load waterfalls, JS errors, and session replays tied directly to backend traces.
Intelligent Alerting
Multi-signal alert rules with anomaly detection, seasonality awareness, and composite conditions — alert on what matters, silence what doesn't.
On-Call & Escalation
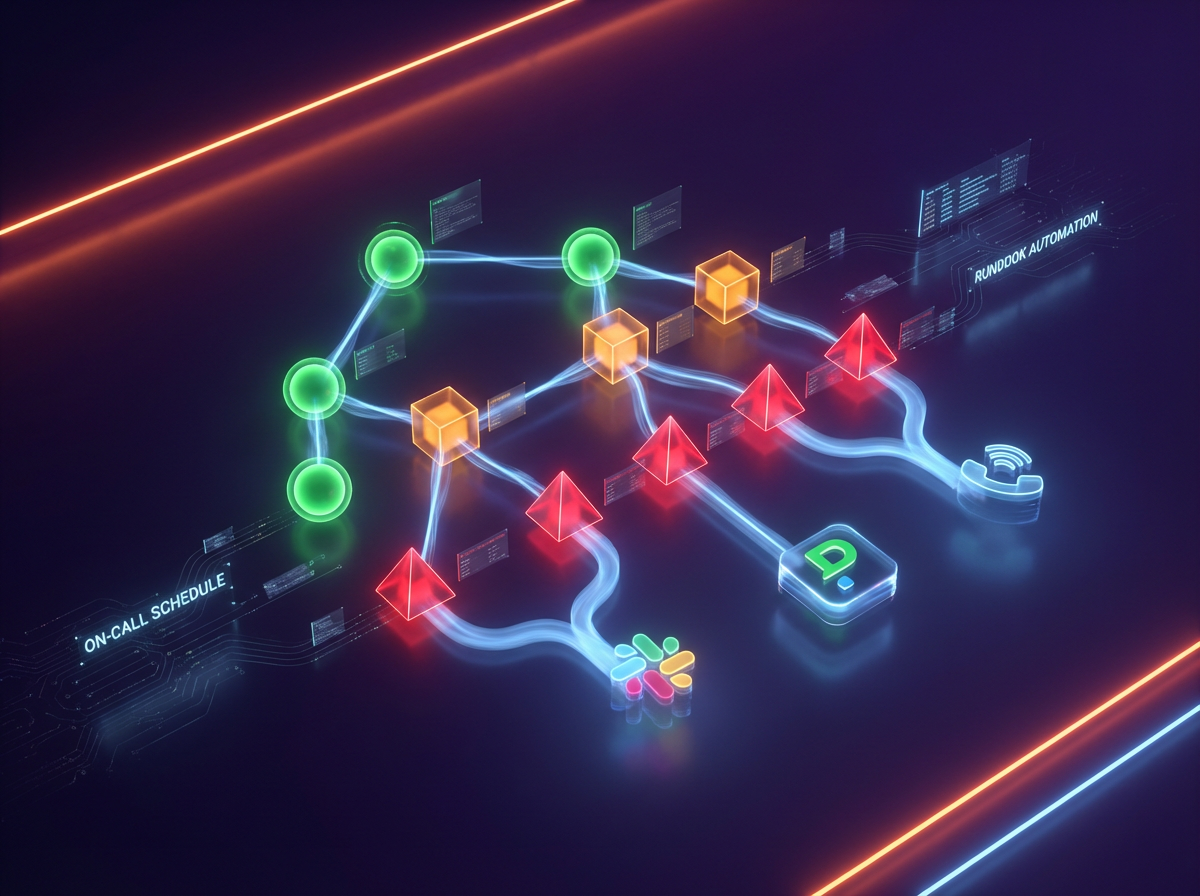
Automated rotation schedules, tiered escalation policies, and acknowledgement tracking — the right engineer gets paged, every time, with full context.
Runbook Automation
Auto-triggered remediation playbooks for known failure modes — restart pods, scale capacity, or failover DNS before a human even opens a laptop.
How We Work
From noisy dashboards to signal-driven operations
Coverage Assessment
We map every critical path — user-facing endpoints, background jobs, third-party dependencies, infrastructure — and identify what's monitored, what's missing, and what's noisy.
Monitor Design & Build
Health checks, synthetic tests, RUM instrumentation, and golden-signal dashboards — each monitor scoped to an SLO with clear ownership and severity.
Alert Tuning & Routing
Composite alert rules, intelligent grouping, de-duplication, and escalation chains configured across PagerDuty, Opsgenie, or Slack — zero alert fatigue from day one.
Operate & Improve
Monthly noise audits, SLO reviews, new-service onboarding, and runbook expansion — your monitoring evolves as fast as your product.
Technology
Best-of-breed tooling. Zero vendor lock-in.
We integrate with the monitoring and incident platforms your team already trusts — or help you choose the right stack from scratch.
Uptime
- Pingdom
- Checkly
- Uptime Robot
- StatusCake
- Blackbox Exporter
Metrics
- Prometheus
- Datadog
- Grafana Cloud
- CloudWatch
- Azure Monitor
RUM
- Datadog RUM
- Sentry
- New Relic Browser
- Dynatrace
- Faro
Alerting
- PagerDuty
- Opsgenie
- Grafana Alerting
- VictorOps
- Rootly
Status Pages
- Statuspage.io
- Instatus
- Cachet
- Better Stack
- Oh Dear
Automation
- Rundeck
- PagerDuty Automation
- AWS SSM
- Ansible
- Custom Webhooks
Ready to stop finding out about outages from your users?
Tell us about your stack. We'll audit your monitoring coverage, design an alerting architecture, and give you a clear rollout plan — no obligations.