
Observe
Business Monitoring
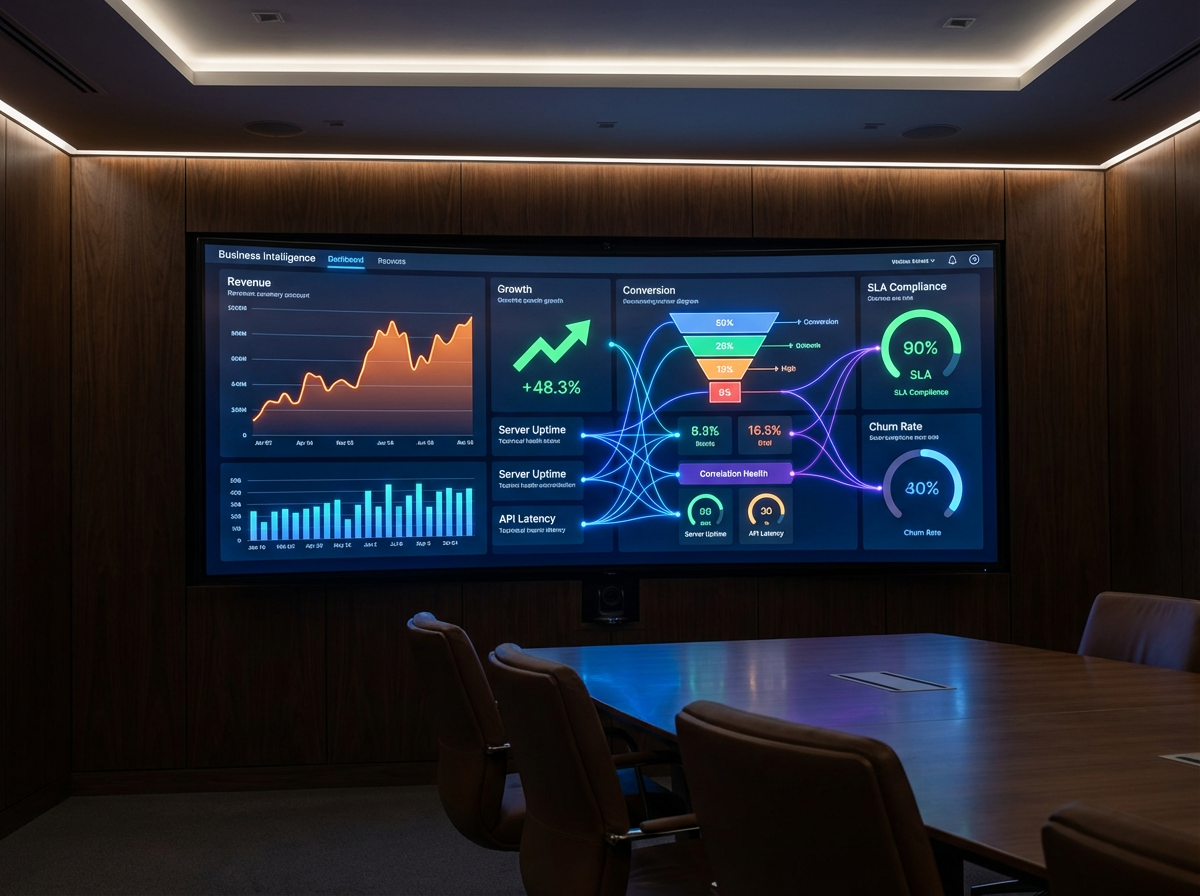
KPIs and tech signals on one screen. We connect your revenue, conversion, and growth metrics to the infrastructure underneath — so when something breaks, you know the business impact in seconds, not days.
Your Grafana says “green.” Your revenue says otherwise.
Engineering teams monitor CPU, memory, and error rates. Leadership tracks revenue, churn, and conversion in spreadsheets updated weekly. Neither side sees the full picture — and when a subtle API regression silently drops checkout completion by 8%, it takes days to connect the dots.
CBM bridges the gap. We build unified dashboards that correlate technical signals with business KPIs in real time — so a latency spike on the payment endpoint immediately surfaces as a revenue-per-minute drop, complete with root cause, blast radius, and estimated financial impact.
12min
Median time to detect revenue-impacting incidents
35%
Faster incident resolution when business context is attached
100%
SLA visibility — no more end-of-month surprises
What We Deliver
Where business metrics meet technical truth
We don't just build dashboards — we build the data pipelines, correlation logic, and alerting rules that turn raw signals into executive-ready business intelligence.
KPI Dashboards
Revenue, conversion rates, order volumes, churn, and LTV — real-time business metrics on dashboards your C-suite actually opens every morning.
Tech-to-Business Correlation
Automatically link deployment events, latency spikes, and error surges to changes in revenue, signups, or cart abandonment — prove the business impact of every incident.
Business-Level Alerting
Alert when revenue-per-minute drops, checkout conversion dips below threshold, or signup rates flatline — not just when a server is unhealthy.
Funnel & Conversion Tracking
Instrument every step of your critical funnels — signup, onboarding, checkout, renewal — with drop-off analysis and cohort comparison built in.
SLA & SLO Reporting
Customer-facing SLA dashboards and internal SLO burn-rate tracking — know exactly how much error budget remains before commitments are breached.
Data Source Integration
Pull from Stripe, Salesforce, HubSpot, Segment, your data warehouse, and your observability stack — one unified view, no manual spreadsheet stitching.

How We Work
From scattered data to a single source of truth
KPI Discovery
We work with engineering, product, and leadership to define the business metrics that matter — revenue signals, growth indicators, and reliability commitments.
Data Pipeline Design
Map every data source — payment processors, CRMs, analytics platforms, observability backends — and design the ETL/streaming pipelines to unify them in near real-time.
Dashboard & Alert Build
Build executive dashboards, team-level views, and business-signal alerts — each metric tied to an owner, a threshold, and an escalation path.
Iterate & Expand
Monthly reviews to add new KPIs, refine thresholds, onboard new data sources, and train your team to self-serve — the system grows with your business.
Technology
Your data sources, unified.
We integrate with your payment processors, CRMs, analytics platforms, warehouses, and observability stacks — no manual exports, no stale spreadsheets.
Visualisation
- Grafana
- Looker
- Metabase
- Tableau
- Power BI
Data Pipelines
- dbt
- Airbyte
- Fivetran
- Kafka
- Spark
Warehouses
- BigQuery
- Snowflake
- Redshift
- ClickHouse
- Postgres
Business Data
- Stripe
- Salesforce
- HubSpot
- Segment
- Mixpanel
Observability
- Datadog
- Grafana Cloud
- New Relic
- Prometheus
- OpenTelemetry
Alerting
- PagerDuty
- Opsgenie
- Slack
- Email/SMS
- Custom Webhooks
Ready to see the business impact of every technical decision?
Tell us about your KPIs and data sources. We'll design a unified monitoring architecture and give you a clear implementation roadmap — no obligations.